Return Revenue Dashboard
Overview
The Return Revenue dashboard provides a financial overview of returns, focusing on revenue impact, cost drivers, and reimbursement outcomes. It enables stakeholders to understand how returns affect revenue, identify cost patterns, and evaluate return-related financial performance. This dashboard focuses on financial impact, not operational flow.
This dashboard helps teams to:
- Monitor total revenue associated with returns
- Understand the balance between free and paid returns
- Evaluate return costs such as shipping labels
- Analyse reimbursement methods and retained revenue
- Identify geographic drivers of return-related revenue
Filters
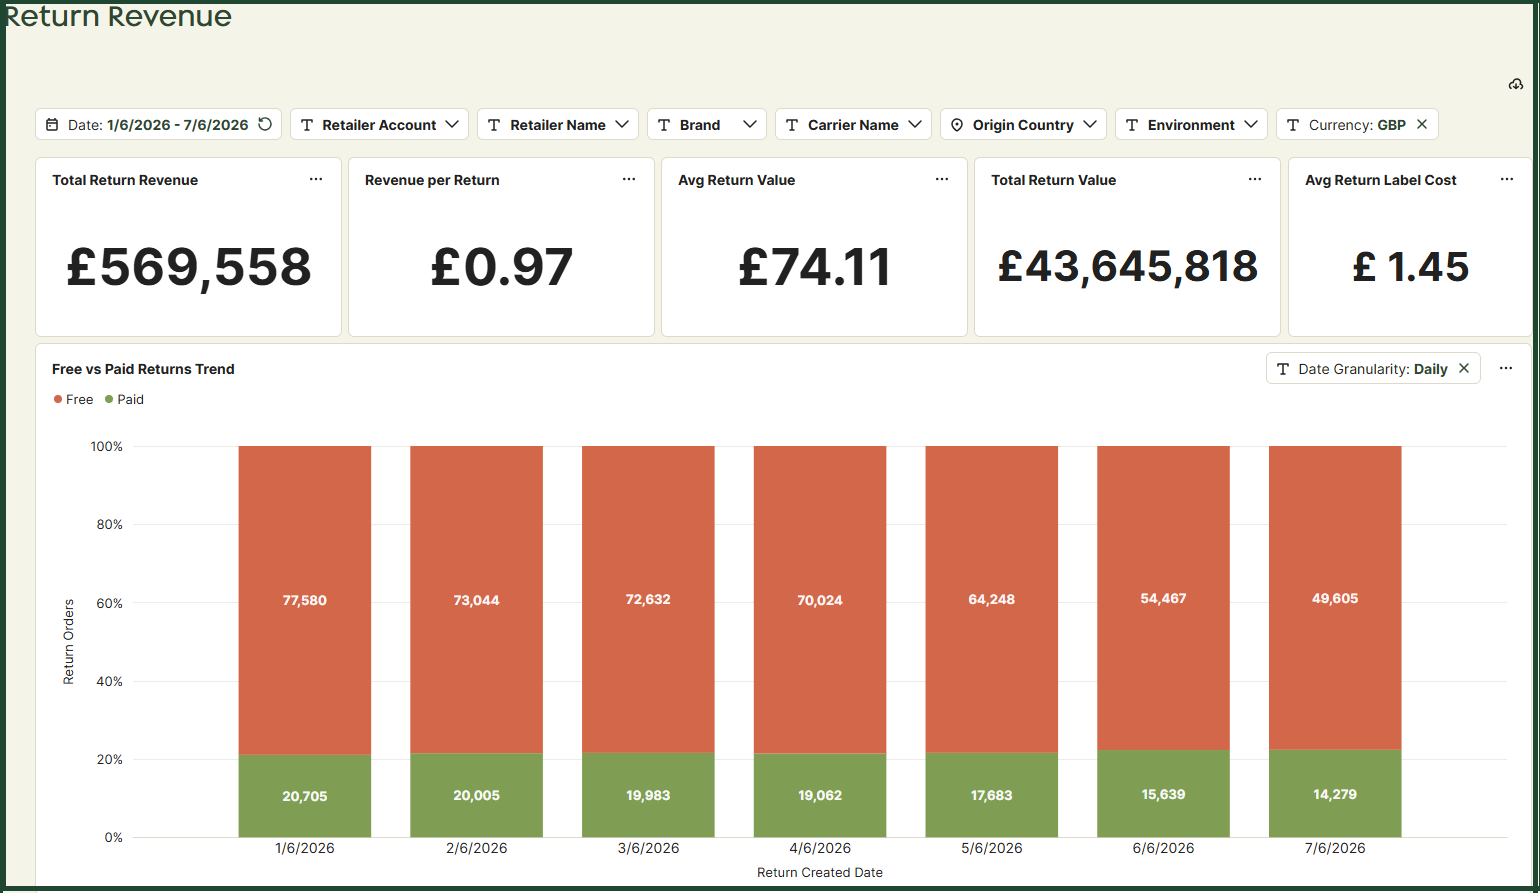
The available filters enable you to customise the data displayed in the dashboards based on specific criteria.

Date Filters
- Date - Filters data based on when the return was created.
Retailer Filters
- Retailer Account - Use this when retailers belong to a larger group using ZigZag’s services.
- Retailer Name - If you have access to multiple retailers, use this filter to select a specific retailer.
- Brand - If the retailer has multiple brands, use this filter to select a specific brand.
Logistics & Operational Filters
- Carrier Name - Refines data by the specific logistics or shipping provider handling the returns.
- Origin Country - Filters metrics by the country from which the return was initiated by the end customer.
- Environment - Filters data by the specific retailer system environment (e.g., ZZ-Live, TVG-Live).
- Currency - Displays values in the selected currency (GBP, EUR, USD)
Key Performance Indicators
This section provides a summary of the core high-level performance metrics for the selected date period:
- Total Return Revenue - Total revenue generated within the selected period.
- Revenue per Return - Average revenue generated per returned order.
- Avg Return Value - Average monetary value of items within each return.
- Total Return Value - Monetary value of items within each return.
- Avg Return Label Cost - Average cost of return shipping labels within paid returns.

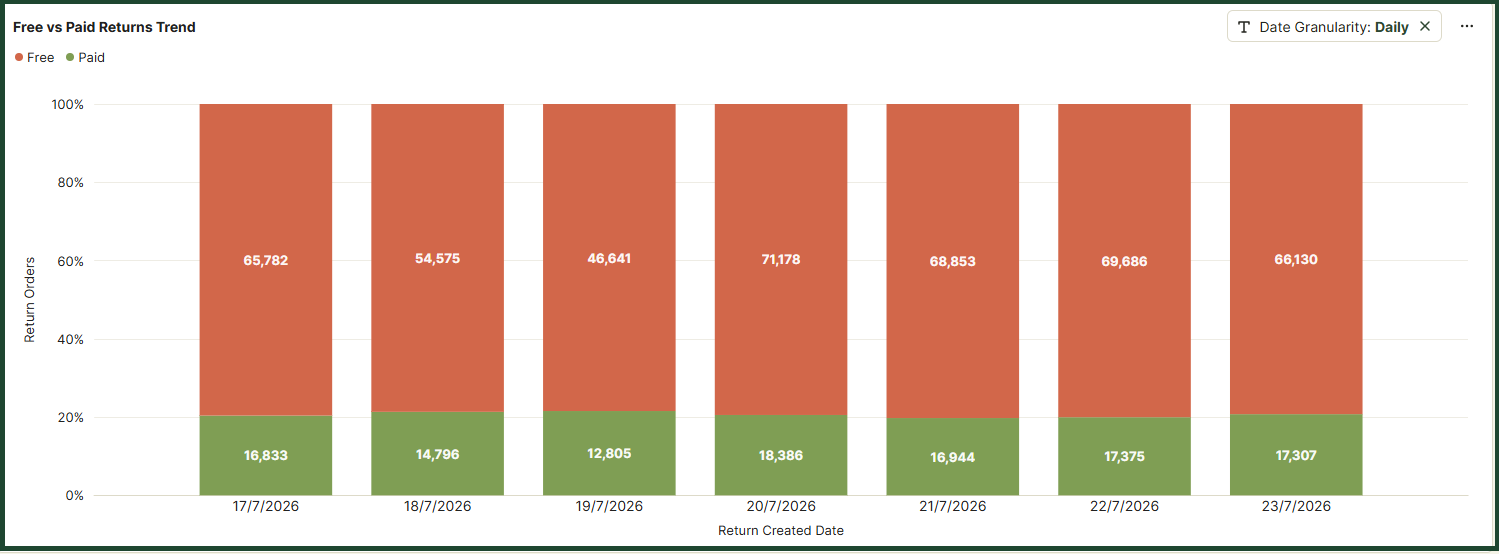
Free vs Paid Returns Trend
The Free vs Paid Returns Trend graph displays the daily proportion of free and paid return orders over the selected time period. It helps assess the impact of return policies on cost and customer behaviour. Use this chart to monitor changes in customer-paid return adoption and identify trends over time. Adjust the Date Granularity filter to view the data by day, week, or month.
Returns by Reimbursement Method
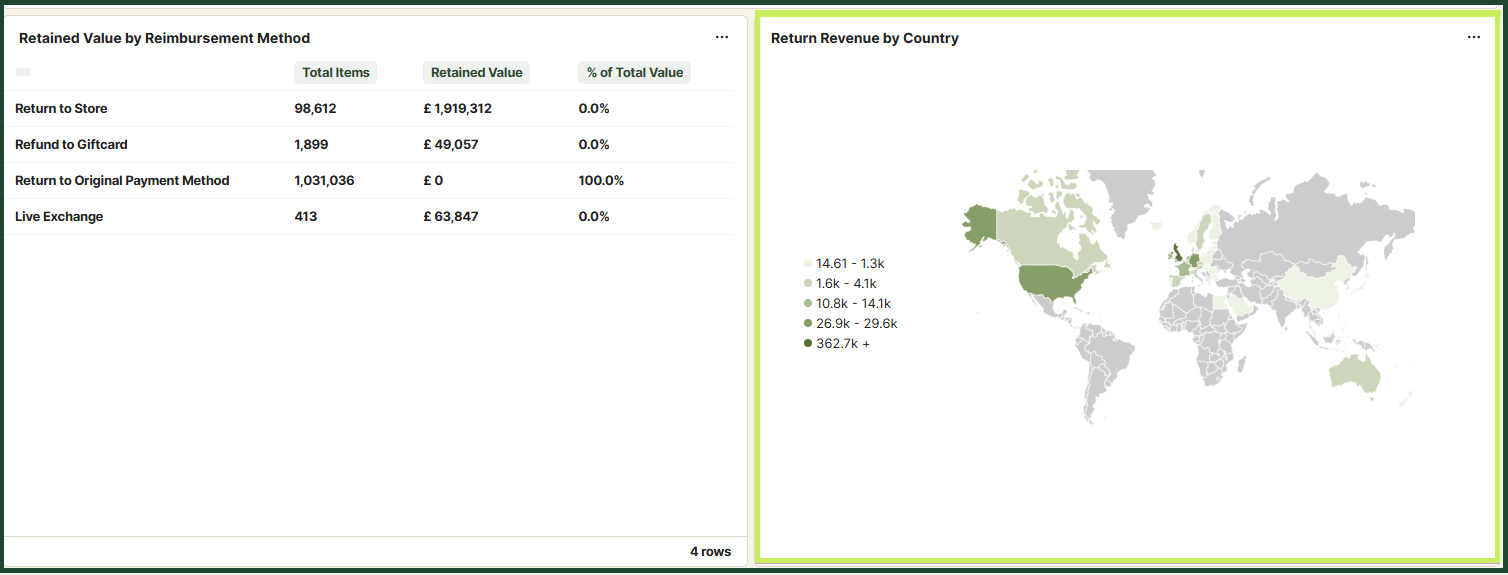
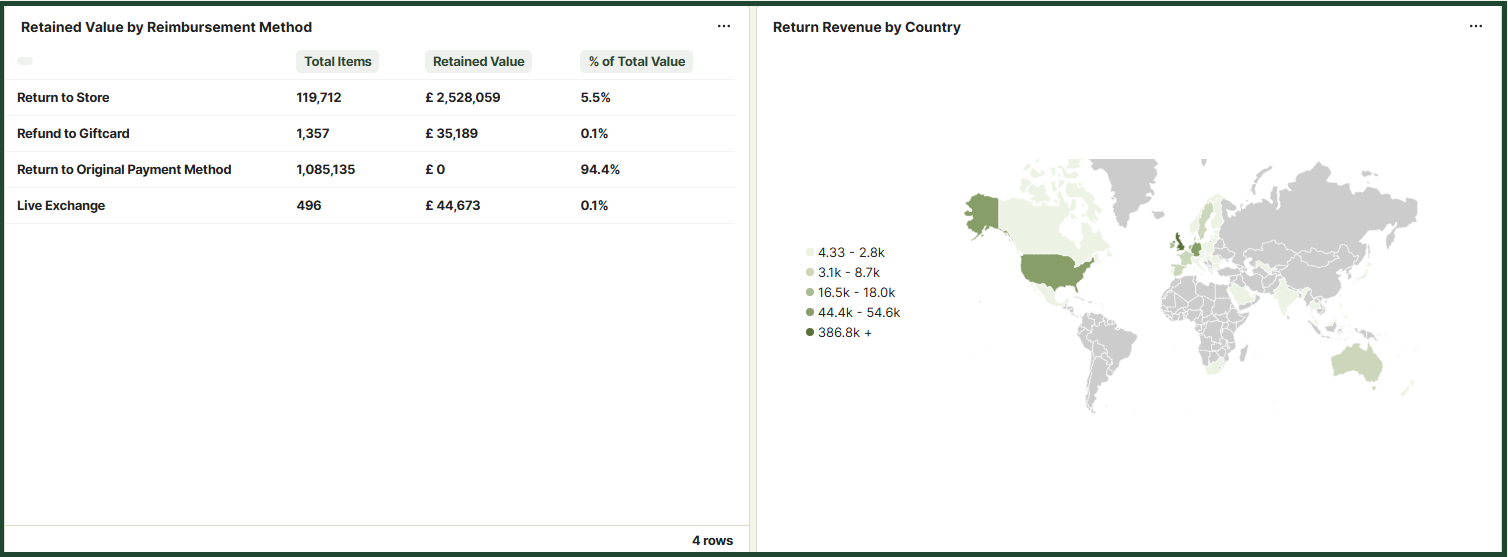
This is a breakdown of how returns are resolved and their financial impact. It includes retained revenue, which reflects revenue preserved through non-refund outcomes (e.g. exchanges or store credit). Retained revenue is a key metric to monitor as it reflects revenue recovery strategies.
- Refund to Giftcard – Returns converted into store credit
- Return to Original Payment Method – Standard refunds
- Live Exchange – Items exchanged for alternatives
- Return to Store – Returns processed in-store
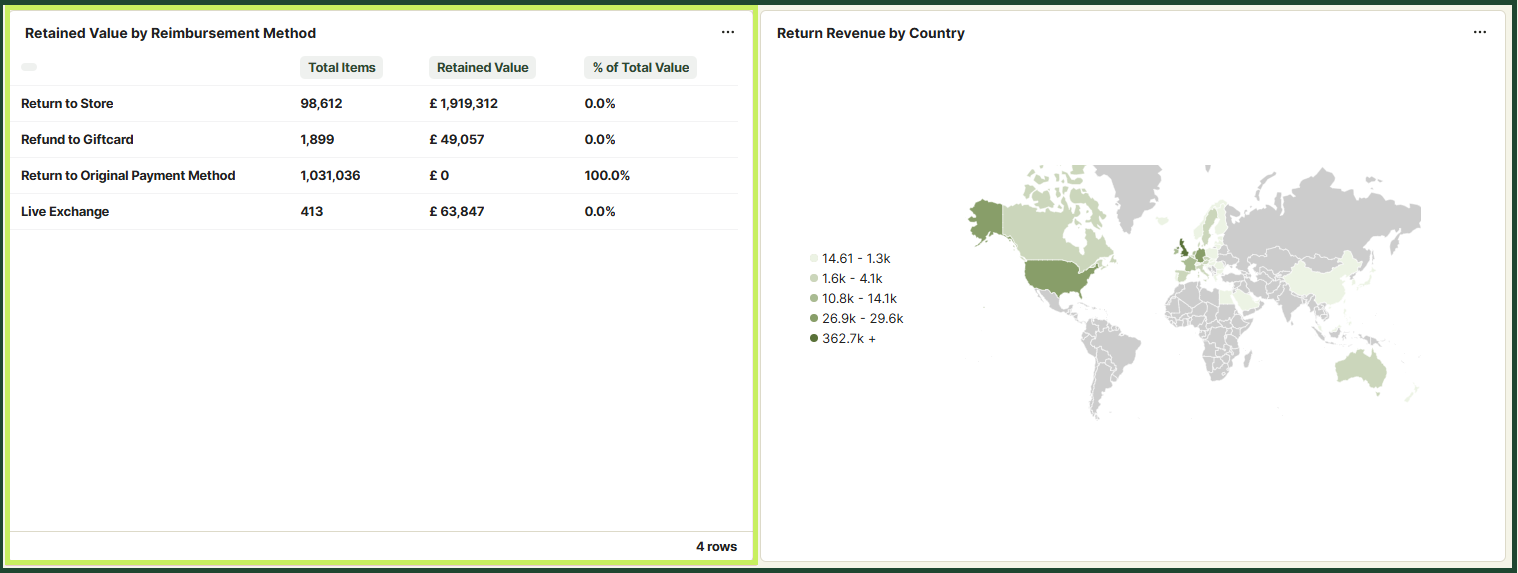
Return Revenue by Country
This is a breakdown of the distribution of return-related revenue across origin countries. “Return revenue” represents the value of returned goods, not net revenue after refunds. It helps identify:
- High-impact markets
- Regional return behaviour
- Revenue concentration risks