Executive Summary Dashboard
Overview
The Executive Summary Dashboard is an interactive reporting tool designed to provide high-level stakeholders with a comprehensive overview of return performance, key financial metrics, logistics statuses, and geographical trends.
By consolidating critical fulfilment and return data, the dashboard enables you to monitor operational health, identify regional fluctuations, evaluate brand performance, and track return trends over time to optimize the post-purchase customer experience.
The Executive Summary Dashboard contains the following sections:
- Filters
- Key Performance Indicators (KPIs)
- Daily Return Volume Trend
- Returns by Statuses
- Returns by Origin Country
- Retailer Name Breakdown
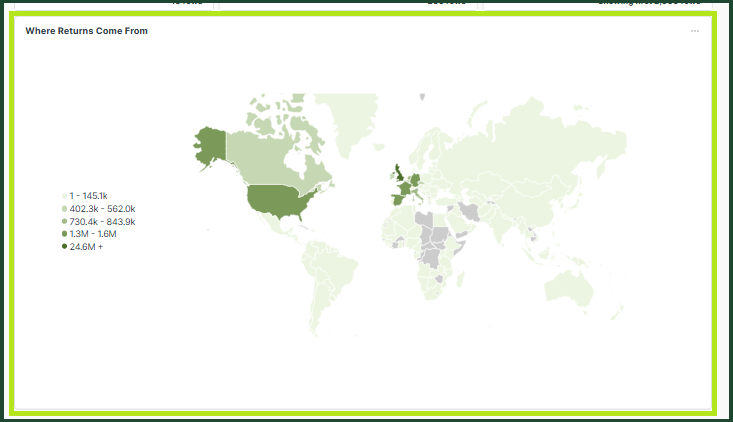
- Where Returns Come From (Geographical Map)
Filters
The available filters enable you to customise the data displayed in the dashboards based on specific criteria.
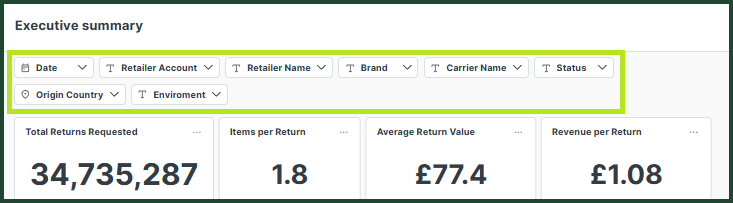
Date filters
- Date - Filters data based on when the return was created.
Retailer Filters
- Retailer Account - Use this when retailers belong to a larger group using ZigZag’s services.
- Retailer Name - If you have access to multiple retailers, use this filter to select a specific retailer.
- Brand - If the retailer has multiple brands, use this filter to select a specific brand.
Shipping Filters
- Carrier Name - The carrier used to ship the return.
- Carrier Service Name - The specific carrier service used for shipping.
Logistics & Operational Filters
- Carrier Name - Refines data by the specific logistics or shipping provider handling the returns.
- Status - Filters the dashboard based on where the return status (e.g., Requested, In Transit, Delivered to Retailer).
- Origin Country - Filters metrics by the country from which the return was initiated by the end customer.
- Environment - Filters data by retailer environment.
Key Performance Indicators
This section provides a summary of the core high-level performance metrics for the selected date period:
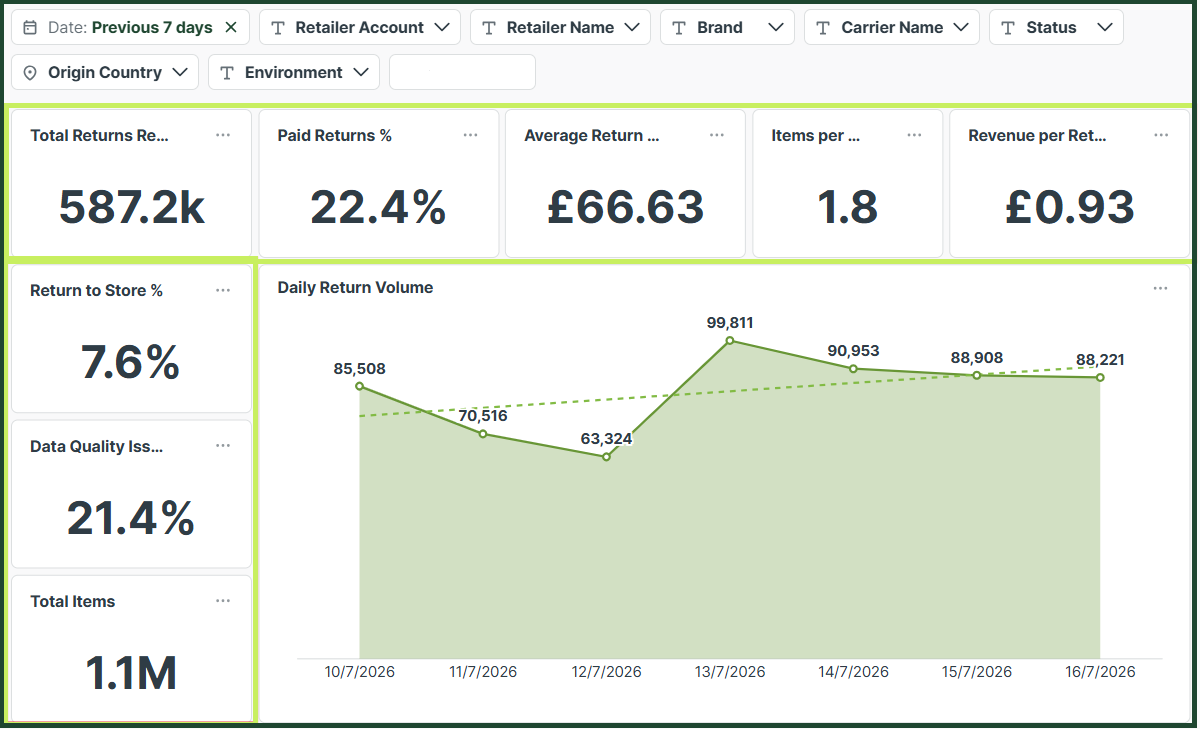
- Total Returns Requested - The total number of unique return requests initiated by customers within the selected period.
- Paid Returns % - The percentage of returns where the return shipping or processing fee is paid for by the customer.
- Average Return Value - The average monetary value of a return request, displayed in British Pounds (£).
- Items per Return - The average number of individual items included in a single return request.
- Revenue per Return - A financial indicator representing the relative revenue impact/recovery allocated per return.
- Return to Store % - The percentage of returns that were directly returned to store.
- Data Quality Issues % - A metric tracking the percentage of clean, validated data incoming through the platform for international returns.
- Total Items - The overall total volume of individual items processed as returns within the selected period.
Daily Return Volume
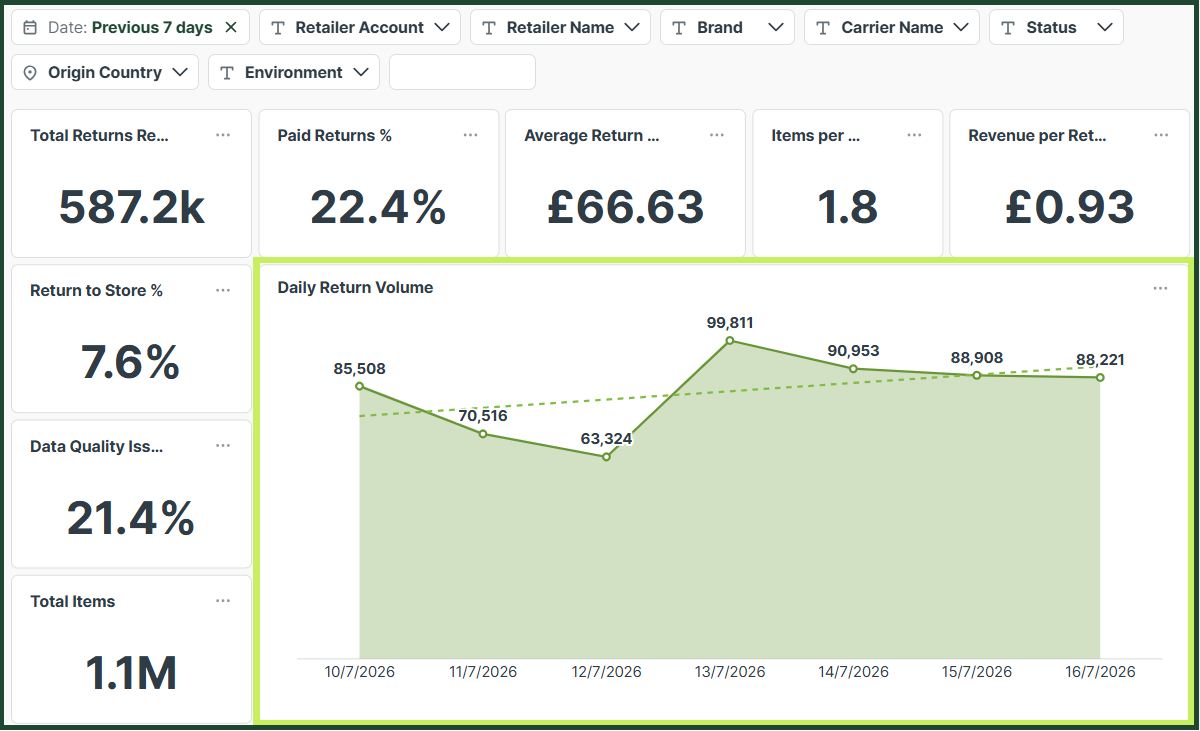
The Daily Return Volume line area visualises the fluctuation of daily return volumes over the selected date range, while also showing the trend line. It allows businesses to monitor daily operational capacities, identify specific days of the week with peak return activity, and observe upward or downward trajectories over time.
Returns by Statuses
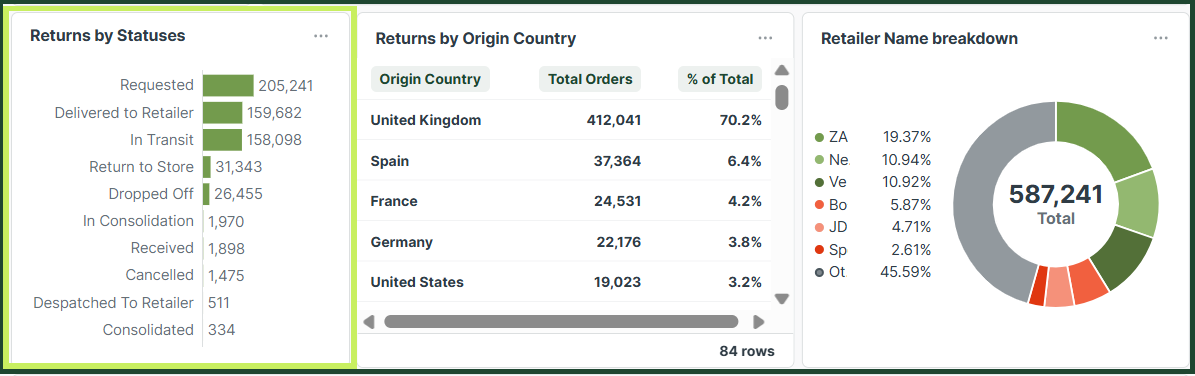
This row bar chart breaks down the total number of return orders based on their real-time logistics and processing lifecycle stage. Key statuses include:
- Requested - The return has been initiated by the customer but not yet dropped off.
- Dropped Off - The items have been scanned at an authorized carrier drop-off point.
- In Transit - The items are currently with the carrier moving toward the destination.
- Received - The items have physically arrived at the hub or processing centre and have been scanned into the warehouse management system.
- In Consolidation - The individual returned items are currently being collected and sorted into larger pallets at a local hub.
- Consolidated - The bulk grouping process is complete, and the sorted batch of items is packed and ready for efficient mass transport to its final destination.
- Delivered to Retailer - The items have successfully arrived at the retailer's designated warehouse or processing facility.
- Return to Store - The items have been returned directly to a physical retail location.
- Cancelled - A previously created return request that has been invalidated, either because the customer decided to keep the item or the return window expired.
Returns by Origin Country
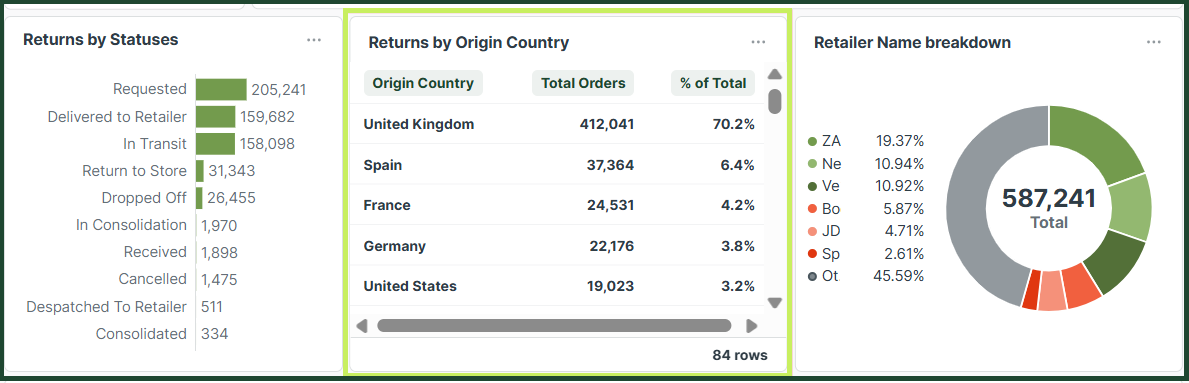
This table shows where your returns are physically coming from, ranking countries by their total volume of return orders. It displays:
- Origin Country - The country from which the customer sent the item.
- Total Orders - The absolute number of return requests originating from that specific country.
- % of Total - The percentage share that the country represents out of the global return volume, helping identify high-rate regional markets.
Records with a missing Origin Country value are grouped under the "Missing Country" row in the table.
Retailer Name Breakdown
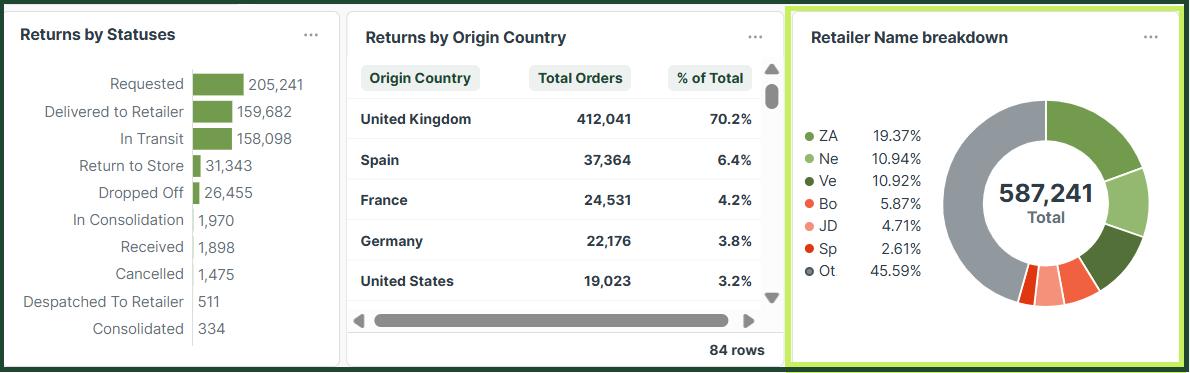
For multi-brand retailers, this donut chart lists individual brands based on their total volume of return orders. It helps inventory and product teams quickly see which brands are contributing the heaviest volume to the overall return ecosystem.
Where Returns Come From
The interactive world map visualisation uses colour-density shading to illustrate global return distributions. Countries are colour-coded based on volume brackets (ranging from low volumes like 1–2.0k up to heavy volumes of 390.4k+), providing an instant, visual understanding of global return concentrations at a glance.