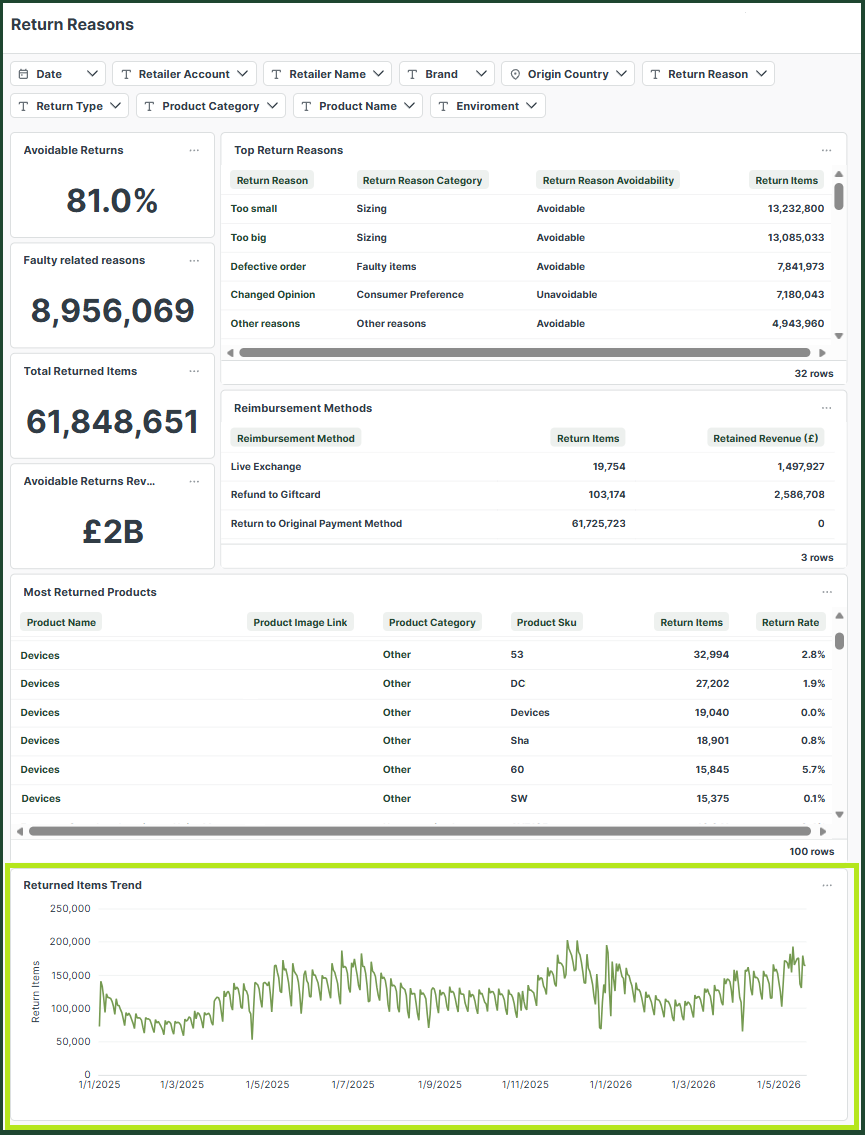
Return Reasons Dashboard
The Return Reasons Dashboard provides you with detailed insights into the primary reasons customers request returns, as well as their preferred reimbursement methods. The dashboard enables you to identify avoidable return reasons, helping take proactive measures to reduce preventable returns and improve the customer experience.
In addition, you can analyse return activity by Return Reason, gaining a clearer understanding of recurring issues and return trends over time. The dashboard also provides return rate insights at the product level, allowing the identification of products with the highest return volumes during specific periods and monitoring of return patterns and trends.
The Return Reasons Dashboard contains the following sections:
- Filters
- Key Performance Indicators
- Top Return Reasons
- Reimbursement Methods
- Most Returned Products
- Returned Items Trend
Filters
The available filters enable you to customise the data displayed in the dashboards based on specific criteria.
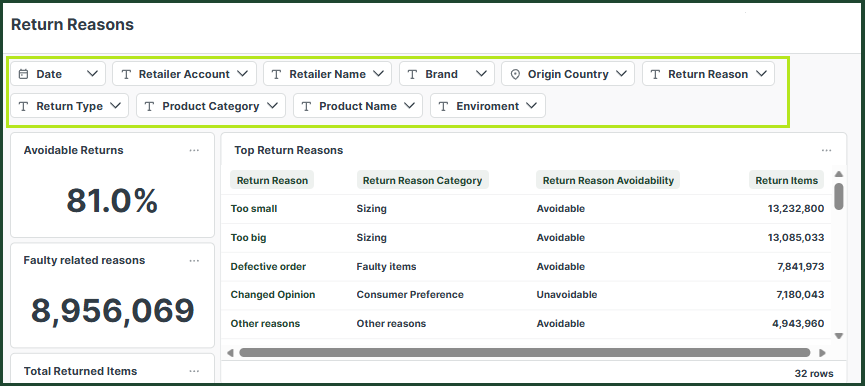
Date Filters
- Date - Filters data based on when the return was created.
Retailer Filters
- Retailer Account - Use this when retailers belong to a larger group using ZigZag’s services.
- Retailer Name - If you have access to multiple retailers, use this filter to select a specific retailer.
- Brand - If the retailer has multiple brands, use this filter to select a specific brand.
Location Filters
- Origin Country - The country from which the return is sent by the end customer.
Return Related Filters
- Return Reason - The return reason selected by the customer.
- Return Type - The type of return selected by the customer (Exchange, Mobile B2B, Refund, Repair, Return or Unintended Return).
Product Related Filters
- Product Category - The category of the returned item.
- Product Name - The name of the product being returned.
Environment Filter
- Environment - Filters data by retailer environment.
Key Performance Indicators
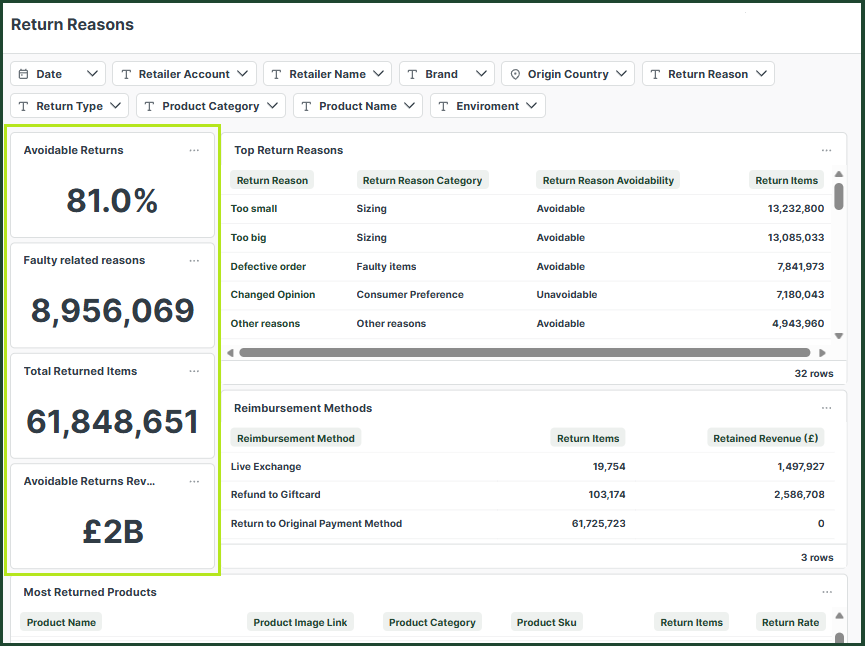
This section provides information on the key performance metrics regarding the return orders for the selected date period:
- Avoidable Returns - The percentage of returns classified as avoidable/preventable (e.g.: sizing issues, incorrect product information).
- Faulty Related Reasons - The total number of returned items due to defects, damage or quality-related issues.
- Total Returned Items - The total number of returned items within the selected period.
- Avoidable Returns Revenue - The estimated revenue associated with the total number of avoidable returns, in British Pounds (£).
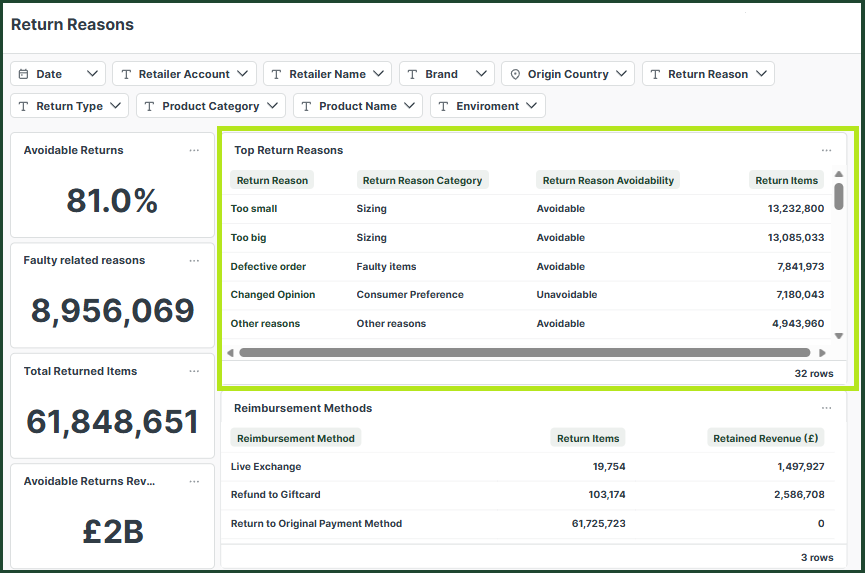
Top Return Reasons
This table shows the Total Number of Return Items per Return Reason, Return Reason Category and Return Reason Avoidability, in a descending order.
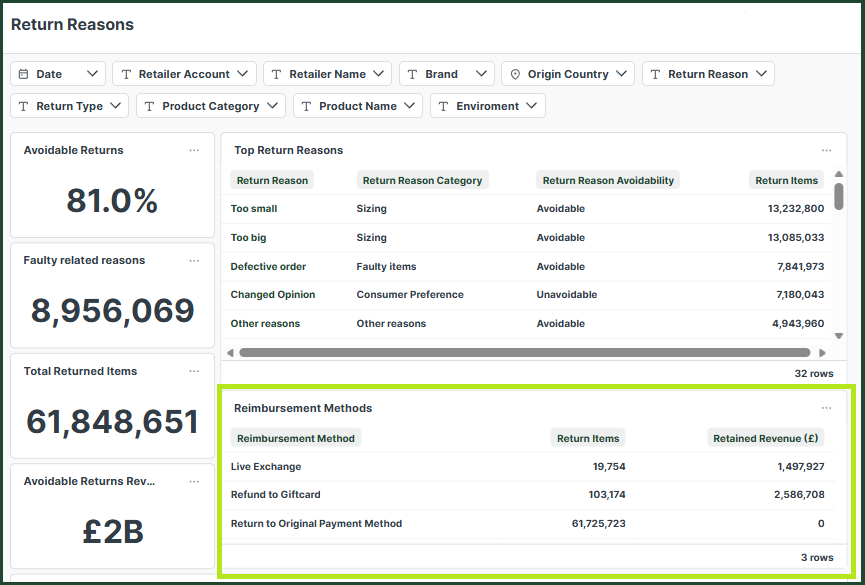
Reimbursement Methods
This table shows the number of returned items by reimbursement method (Live Exchange, Refund to Gift Card, or Return to original payment method) for the selected Date period, as well as the Revenue Retained within the retailer's business, via either the Live Exchange and/or Refund to Gift Card return methods.
Most Returned Products
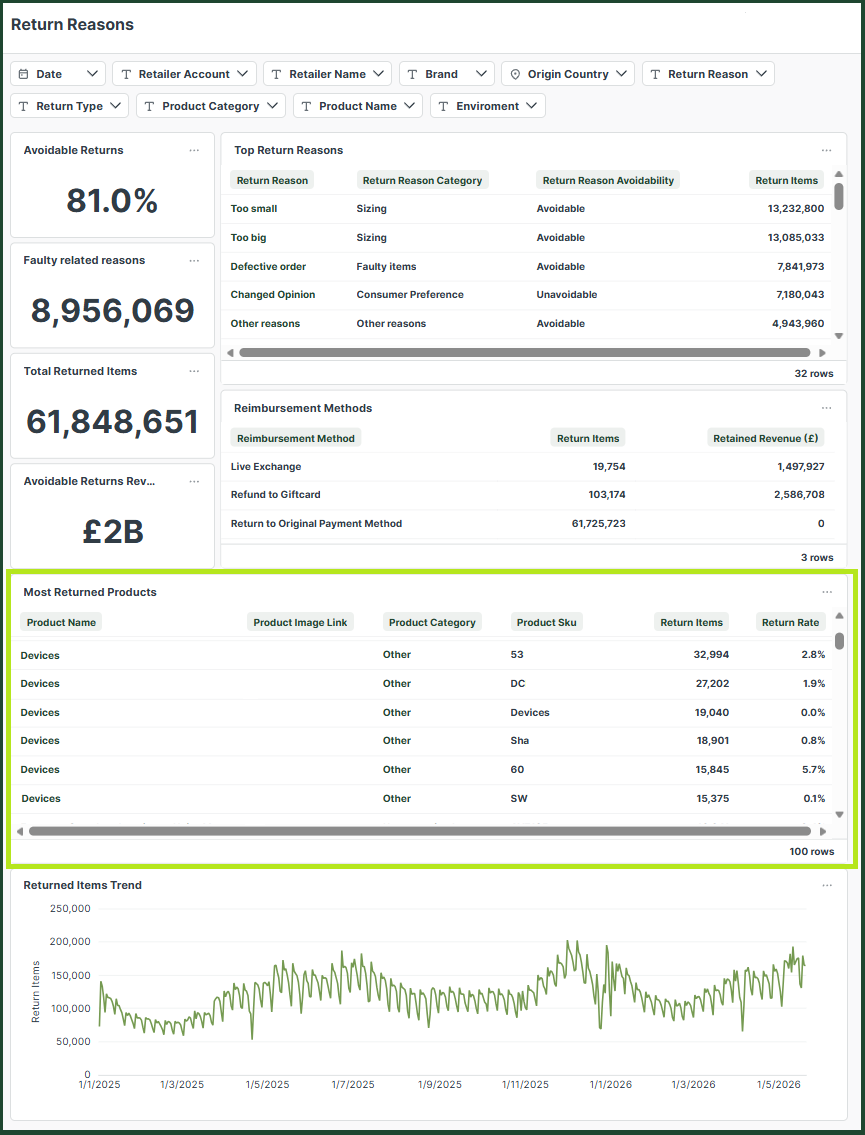
This table shows the number of returned items and the return rate in the selected date period grouped by:
- Product Name - product name as defined in the product feed.
- Product Image Link - product image when available.
- Product Category - product category as defined in the product feed.
- Product SKU - product SKU as defined in the product feed.
Returned Items Trend
This chart shows the total number of returned items, grouped by the Return Created Date at a daily level, based on the date range selected in the Date Filter.