Logistics Performance Dashboard
Overview
The Logistics Performance Dashboard provides you with detailed insights into the return journey of customer orders. It breaks down data at the carrier service level, helping you make informed decisions about carrier and service selection. The report displays the average time (in working days) it takes for return orders to reach the first destination in the journey — either the receiving warehouse or, for single-stop returns, the retailer itself. It also highlights the top-performing service mappings based on 1st mile transit time metrics, and the number of returns that are still in transit.
The 1st Mile Transit Time Report contains the following sections:
- Filters
- Key Performance Indicators
- 1st Mile Transit Time Trend (days)
- Returns Currently in Transit
- 1st Mile Transit Time By Origin Country
- 1st Mile Transit Time by Carrier & Service
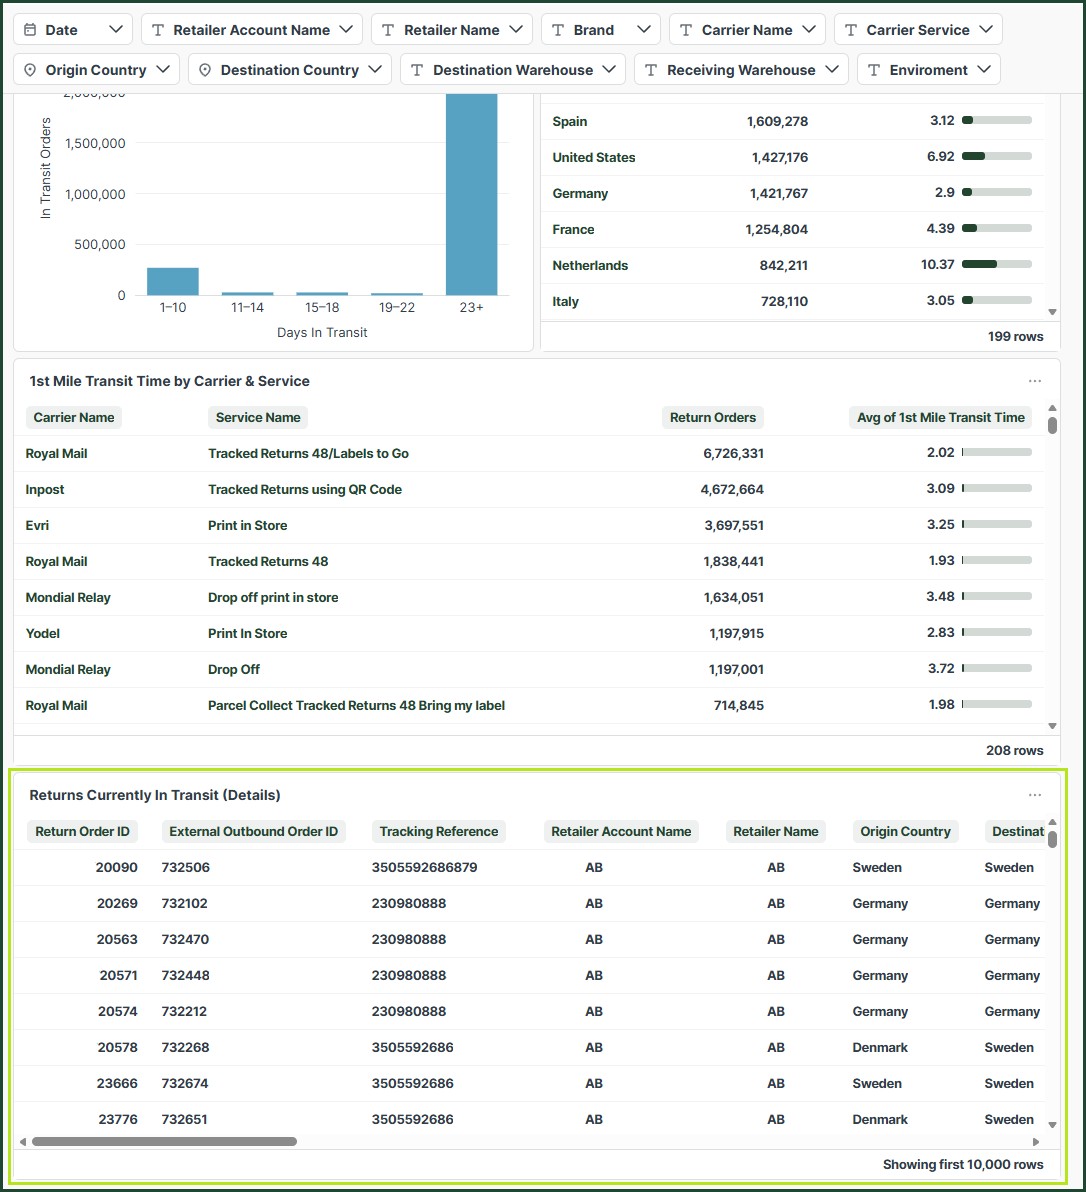
- Returns Currently In Transit (Details)
Filters
The available filters enable you to customise the data displayed in the dashboards based on specific criteria.

Date Filters
- Date - Filters data based on when the return was created.
Retailer Filters
- Retailer Account - Use this when retailers belong to a larger group using ZigZag’s services.
- Retailer Name - If you have access to multiple retailers, use this filter to select a specific retailer.
- Brand - If a retailer has multiple brands, use this filter to select a specific brand.
Shipping Filters
- Carrier Name - The carrier used to ship the return.
- Carrier Service - The specific carrier service used for shipping.
Location Filters
- Origin Country - The country from which the return is sent by the end customer.
- Destination Country - The final country where the return is delivered.
Warehouse Filters
- Destination Warehouse - The final warehouse where the return is delivered.
- Receiving Warehouse - The warehouse where the return is delivered when the first leg is finished, in case of multi leg returns.
Environment Filter
- Environment - Filters data by retailer environment.
Key Performance Indicators
This section provides information on the key performance metrics regarding the return orders for the selected date period:
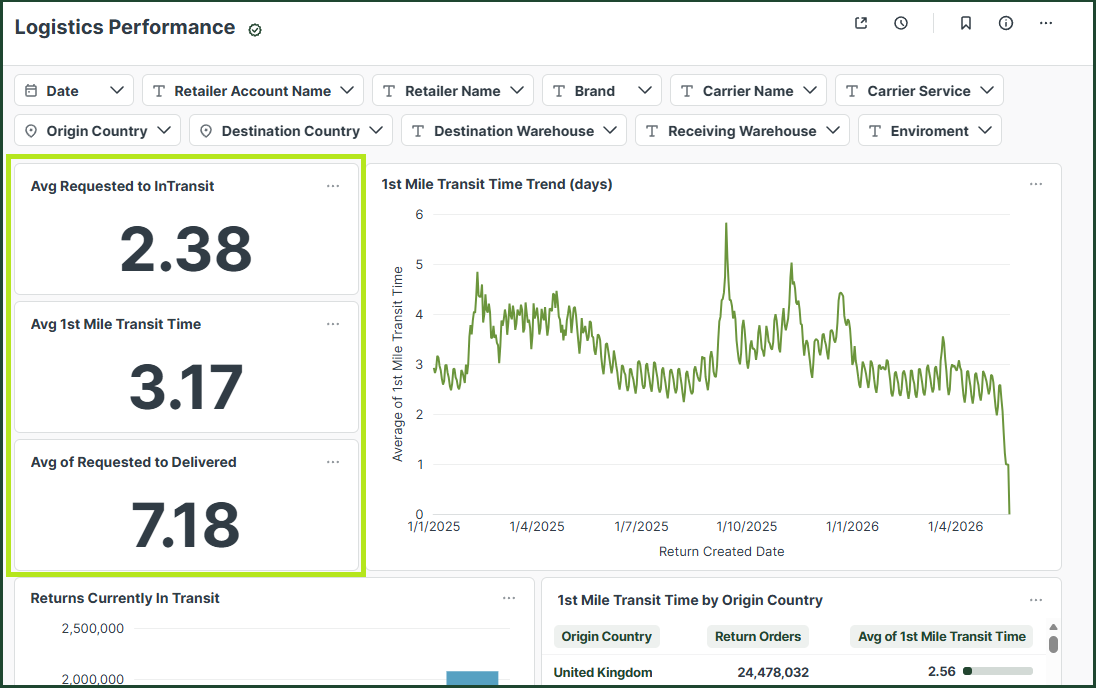
- Avg Requested To In Transit - The average number of days it took for return orders to change status from "Requested" to "In Transit" for the orders that were requested during the selected time period.
- Avg 1st Mile Transit Time - The average number of days that return orders spend in transit before reaching the first receiving warehouse (excluding weekends) in the case of multi-leg journeys, or the retailer in the case of single-leg journeys. The first day in transit is counted as “0”, that is, transit time is calculated as the difference (in network days) between the first in-transit date and the date the order arrives at its first stop (or final stop, if there is only one). If a return goes into transit on a Friday or during the weekend and is also delivered over the weekend, the transit time will be recorded as “1”.
- Avg of Requested to Delivered - The average number of days it took for return orders to change status from "Requested" to "Delivered to Retailer" for the orders that were requested during the selected time period.
1st Mile Transit Time Trends
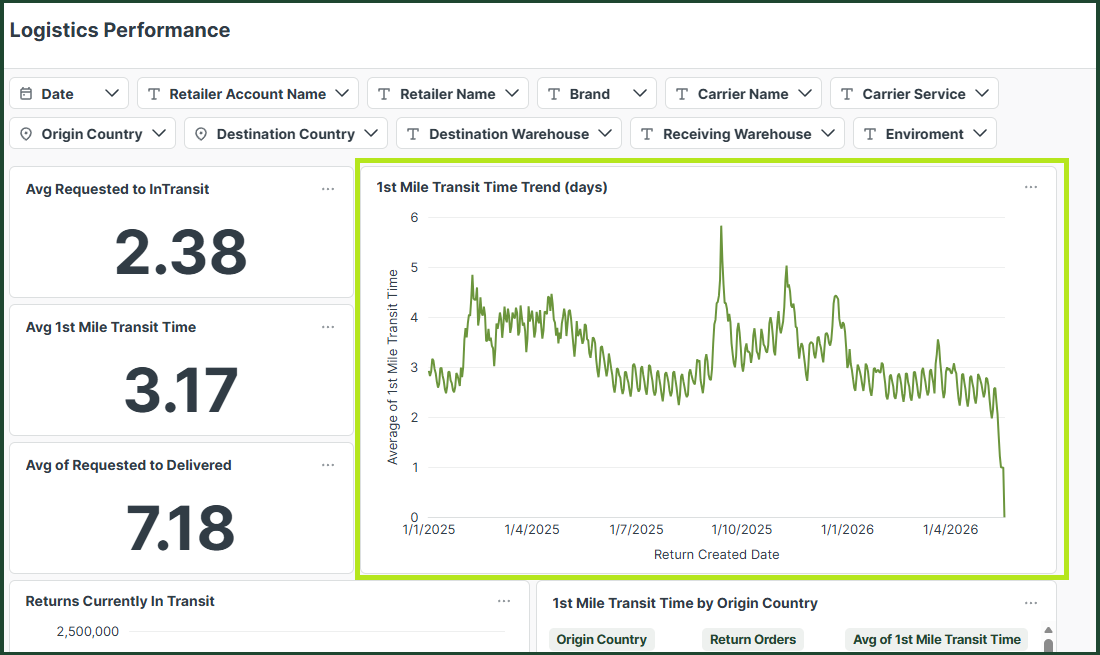
This time-series graph illustrates how the average 1st Mile Transit Time of return orders varies over time.
The 1st Mile Transit Time is calculated using weekdays only and includes only orders that have already been delivered — either to the retailer (for single-leg returns) or to the first receiving warehouse (for multi-leg returns).
If a return goes into transit on a Friday or during the weekend, and arrives at the first stop over the same weekend, the 1st Mile Transit Time is recorded as 1.
Returns Currently In Transit
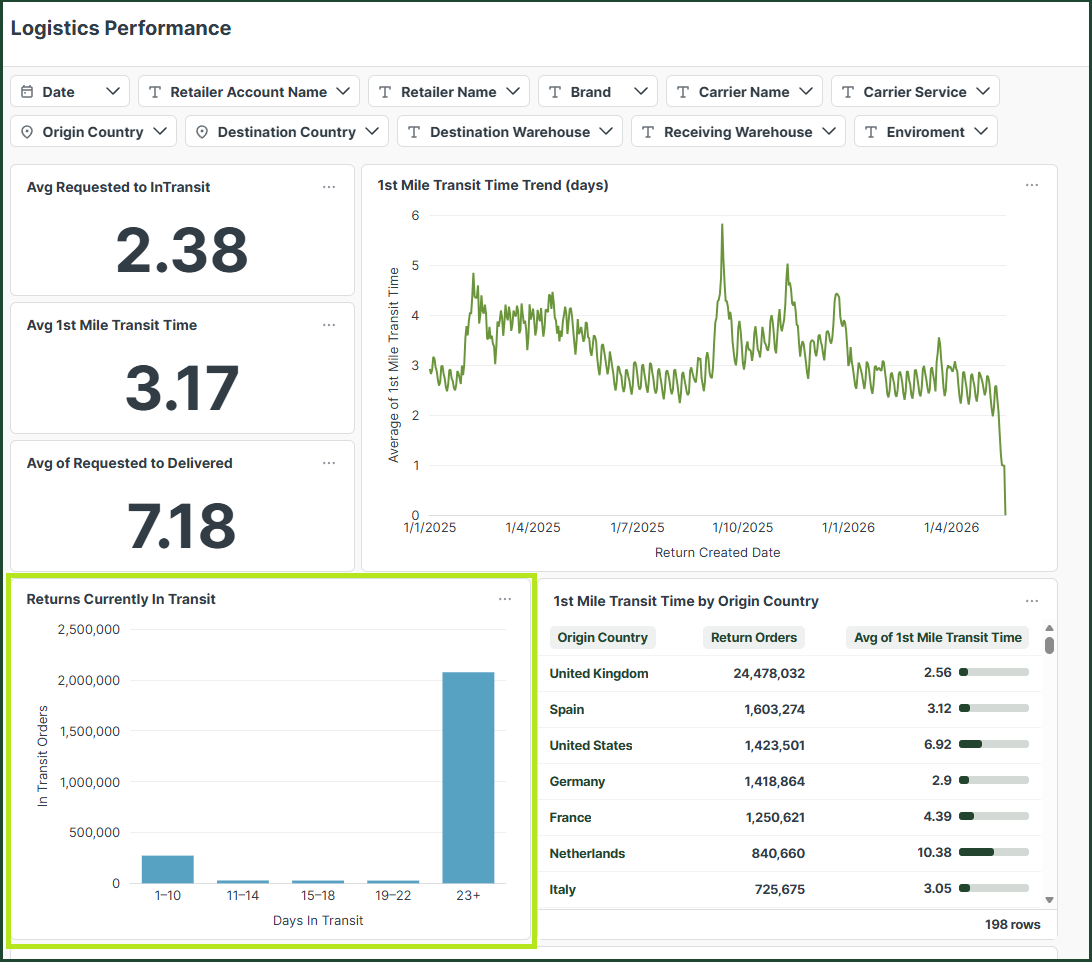
This section of the dashboard displays a graph bar showing the number of returns currently in transit, grouped by the number of days they have been in transit. The data is organized into time intervals (bins).
The first date interval is fixed, and includes returns that have been in transit for 1–10 days. The following intervals for returns currently in transit are: 11-14 days, 15-18 days, 19-22 days and 23+ days.
This dashboard is based on the date the return went in transit. For example, if you select Previous 7 days in the Date filter, the chart will display returns that went into transit during the last 7 days. In this case, only the first interval (1–10 days) will contain data. To view data in the additional intervals, select a longer time range in the Date Selector.
1st Mile Transit Time by Origin Country
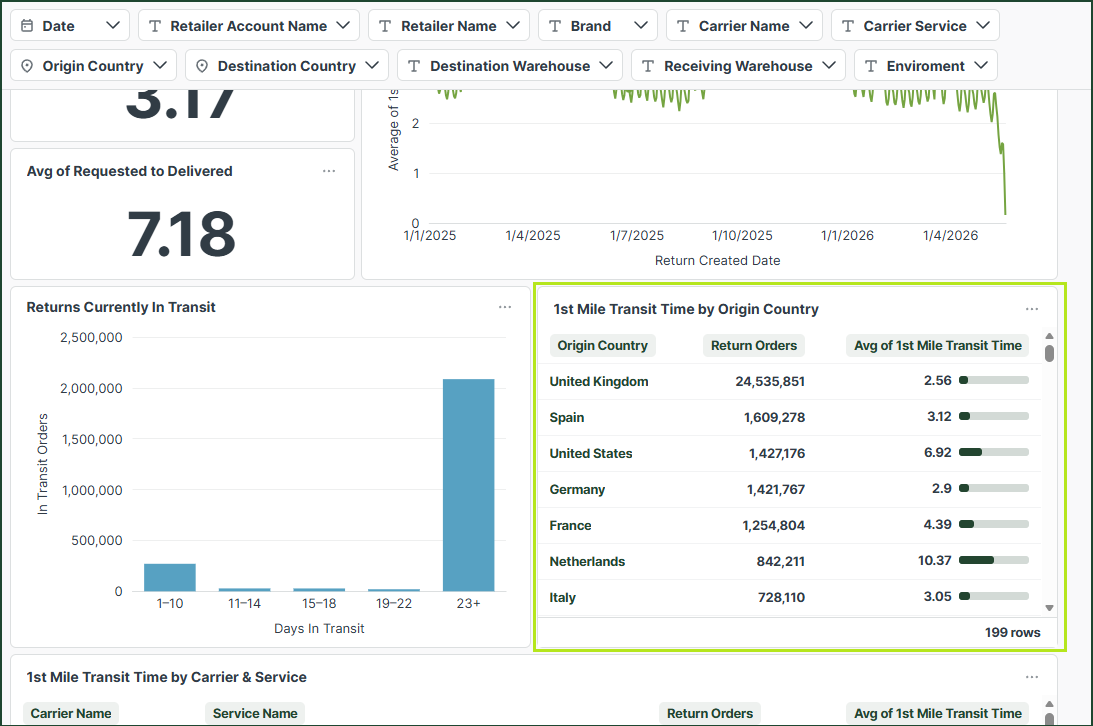
This section of the dashboard displays a table with a list of the Origin Countries, the total number of return orders and the average 1st Mile Transit Time per origin country.
1st Mile Transit Time by Carrier & Service
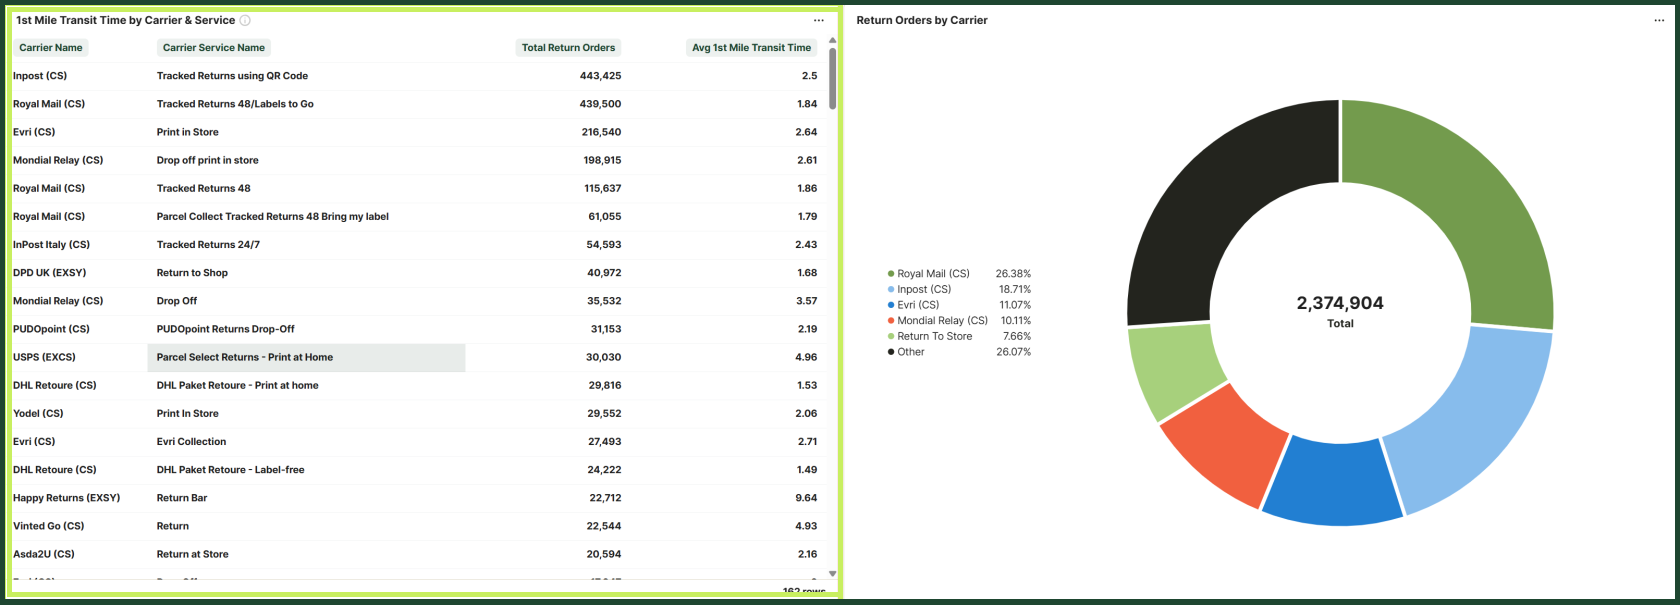
This table displays the Avg of 1st Mile Transit Time and number of Return Orders, grouped by Carrier Name and Service Name.
Returns Currently In Transit (Details)
This table shows the details of the returns that are represented in the Returns Currently In Transit bar graph (i.e., returns without a delivery date).
Fields description
- Return Order ID - The ID number of a return order.
- External Outbound Order ID - The ID number of an outbound order.
- Tracking Reference - The return's tracking reference.
- Retailer Account - For retailers that are part of a larger group that utilizes ZigZag's services.
- Retailer Name - In case you have access to multiple retailer's data, this filter allows you to select the specific retailer you would like to see data for.
- Origin Country - Filters based on the return order origin country, i.e. the country from which the end consumers are sending their returns.
- Destination Country - The final destination country where the order is returned.
- Carrier Name - The name of the carrier used to ship the orders.
- Receiving Warehouse - The middle stop warehouse name in case of multi-leg journeys.
- Receiving Warehouse Country - The country of the middle stop warehouse in case of multi-leg journeys.
- Destination Warehouse - The final stop warehouse name in the return journey.
- Destination Warehouse Country - The country of the final stop warehouse in the return journey.
- Lane Type - Classifies the return as either single-leg or multi-leg depending on the number of stops the return has during the journey to the retailer.
- ZZ Carriage - Shows whether the return uses ZZ Carriage or not.
- Day of Return In Transit - The date when the return started the journey and is in transit.
- Day of Return Delivered to Warehouse - The date when the return status was changed to Delivered to warehouse.
- Day of Return in Consolidation - The date when the return status was changed to In consolidation.
- Day of Return Dispached - The date when the return status was changed to Dispached.
- Day of Return Consolidated - The date when the return status was changed to Consolidated.
- Day of Return Despatched to Retailer - The date when the returns status was changed to Despatched to retailer.
- Transit bins - The bin this return belongs to in the Returns Currently In Transit bar graph section.
- Total Undelivered Transit Time - The total time undelivered returns have been in transit.
- Days in Transit - The number of days the return has been In transit.