Customs Data Quality Dashboard
Overview
The Customs Data Quality Dashboard provides visibility into international (cross-border) return orders where parcels may be delayed at customs due to missing or incomplete information.
The dashboard helps retailers monitor key data points required for efficient border clearance, including:
- HS Codes (when both export and import HS codes are missing)
- Product Country of Origin ID
- Return Price
- Return Item Weight
- Returns without a Carrier Label In addition, the dashboard highlights which product categories and destination countries most frequently contain missing customs-related data.
By identifying data quality gaps early, the Customs Data Quality Dashboard enables retailers to reduce customs delays, improve compliance, and minimize cross-border return issues.
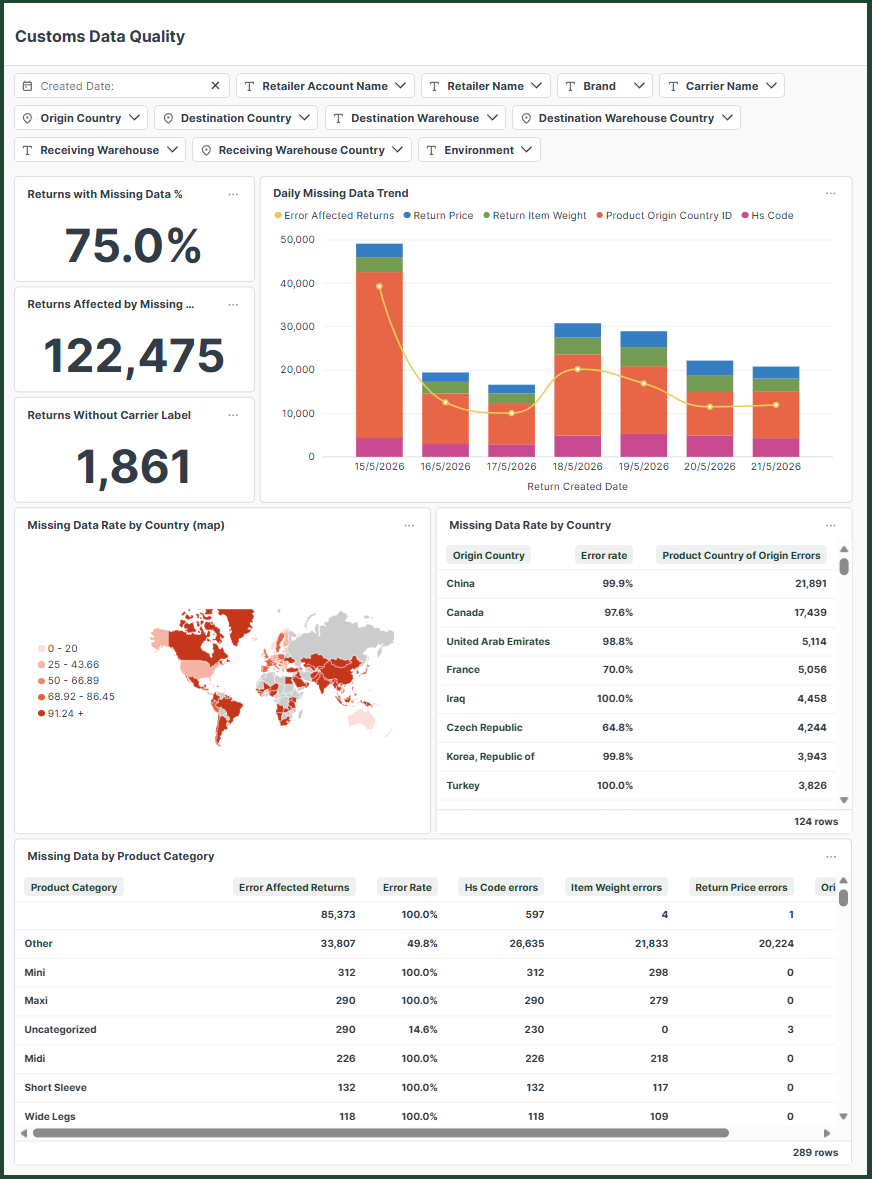
The Customs Data Quality dashboard contains the following sections:
- Filters
- Key Performance Indicators (KPIs)
- Daily Missing Data Trend
- Missing Data Rate by Country (map)
- Missing Data Rate by Country
- Missing Data by Product Category
Filters
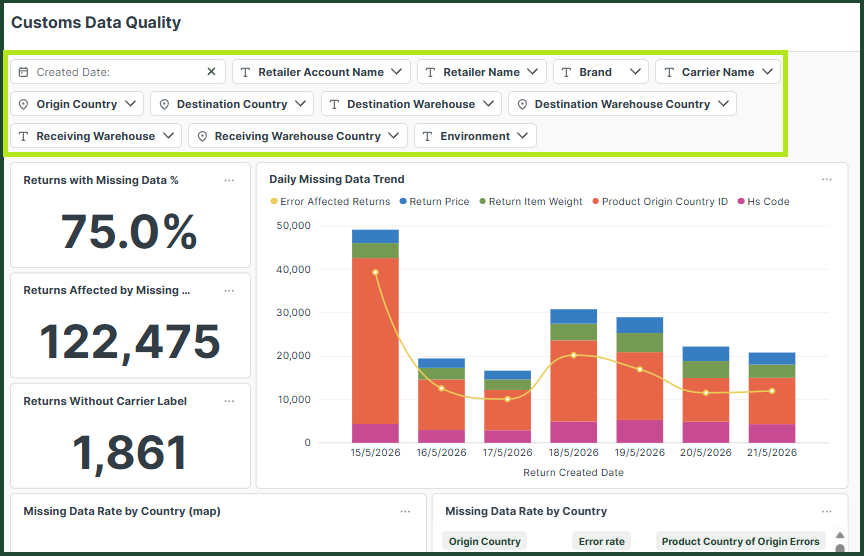
The available filters enable you to customise the data displayed in the dashboards based on specific criteria.
Date Filters
- Date - Filters data based on when the return was created.
Retailer Filters
- Retailer Account - Use this when retailers belong to a larger group using ZigZag’s services.
- Retailer Name - If you have access to multiple retailers, use this filter to select a specific retailer.
- Brand - If a retailer has multiple brands, use this filter to select a specific brand.
Shipping Filters
- Carrier Name - The carrier used to ship the return.
Location Filters
- Origin Country - The country from which the return is sent by the end customer.
- Destination Country - The final country where the return is delivered.
Warehouse Filters
- Destination Warehouse - The final warehouse where the return is delivered.
- Destination Warehouse Country - The final warehouse's country where the return is delivered.
- Receiving Warehouse - The warehouse where the return is delivered when the first leg is finished, in case of multi leg returns.
- Receiving Warehouse Country - The warehouse's country where the return is delivered when the first leg is finished, in case of multi leg returns.
Environment Filter
- Environment - Filters data by retailer environment.
Key Performance Indicators
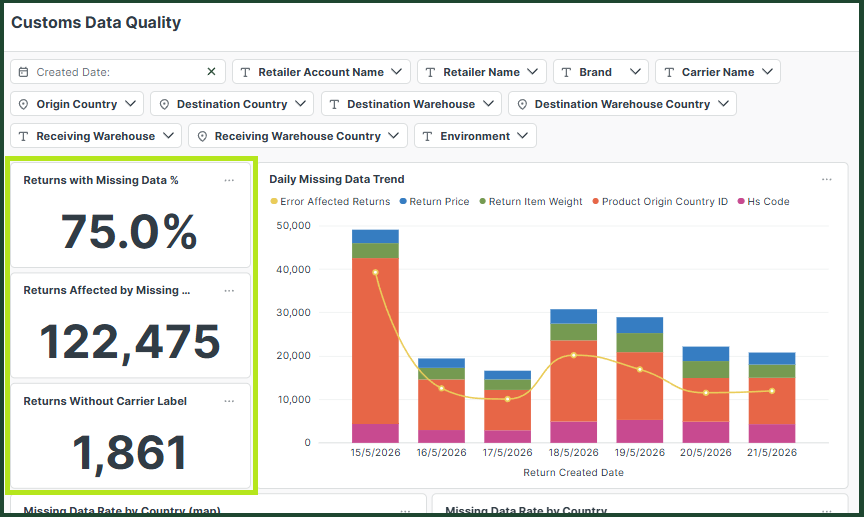
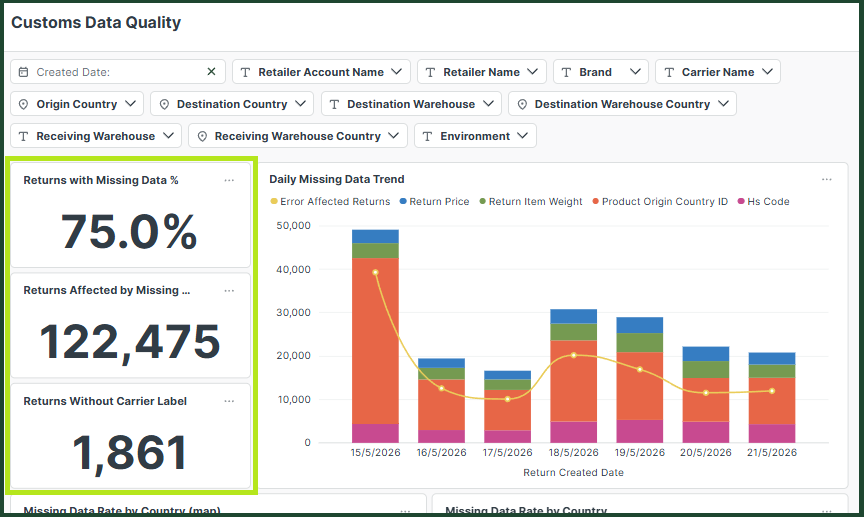
This section provides an overview of the key performance metrics for return orders within the selected date range:
- Returns with Missing Data % - The percentage of cross-border return orders containing one or more missing customs-related data points, including HS Codes, Return Price, Return Item Weight, and/or Product Origin Country ID.
- Returns Affected by Missing Data - The total number of cross-border return orders with one or more missing data points.
- Returns Without Carrier Label - The total number of return orders that do not have an associated carrier label.
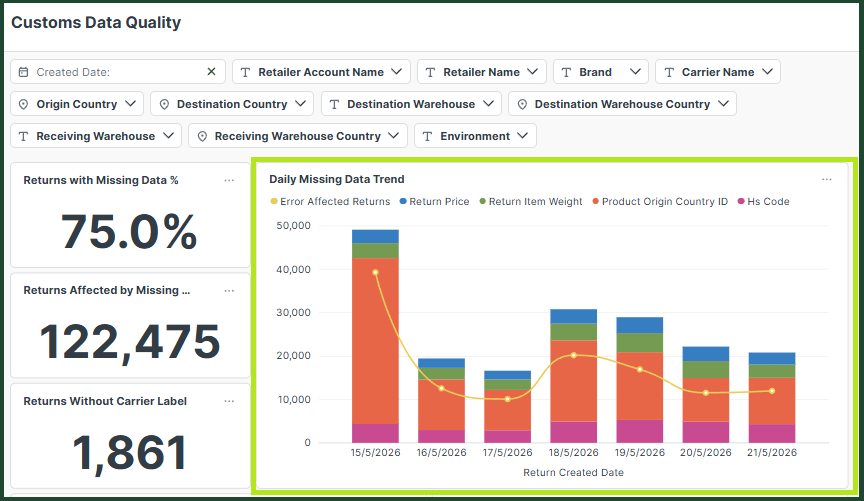
Daily Missing Data Trend
This chart displays the daily volume of missing customs-related information for the selected time period. The stacked bars represent the number of missing data entries per data point, including:
- HS Codes — when both the import and export HS codes are missing
- Return Price — when the returned item price is missing
- Item Weight — when the item weight is missing
- Product Origin Country ID — when the product’s country of origin ID is missing
The yellow line represents the total number of returns containing one or more missing data points per day. Since a single return can contain multiple missing fields, the total number of affected returns shown by the line may be lower than the combined total of all errors displayed in the stacked bars
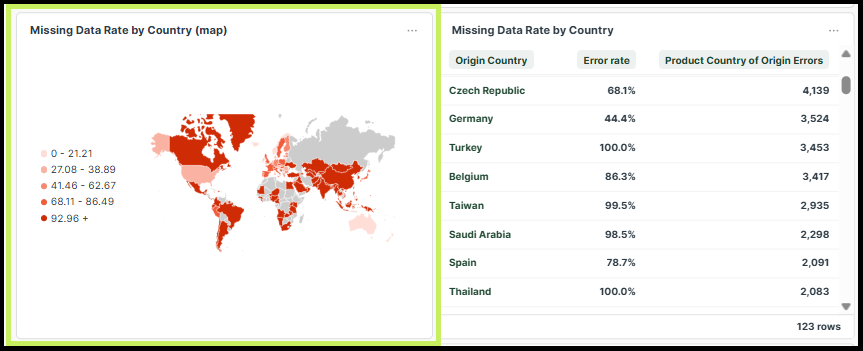
Missing Data Rate by Country (map)
This heatmap visualizes the Missing Data Rate by country — that is, the percentage of return orders containing one or more missing customs-related data points.
The map includes click-to-filter interactivity, allowing users to select any country directly from the visualization. Once selected, the entire dashboard is automatically filtered to display data for the chosen country.
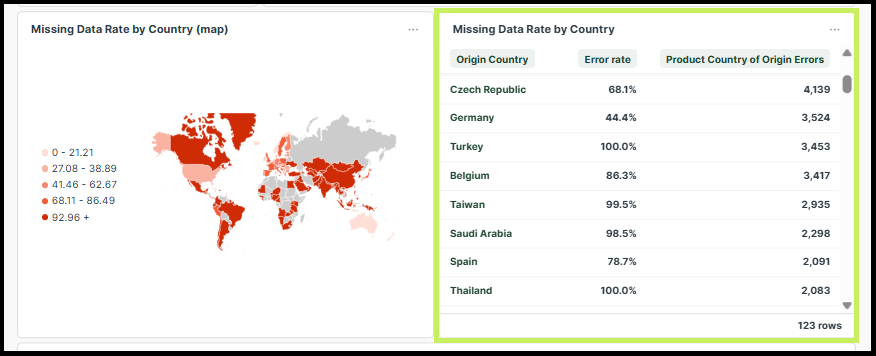
Missing Data Rate by Country
This table provides a country-level breakdown of customs data quality issues, highlighting the countries with the highest overall error rates and the highest number of items missing Product Country of Origin IDs.
Missing Data by Product Category
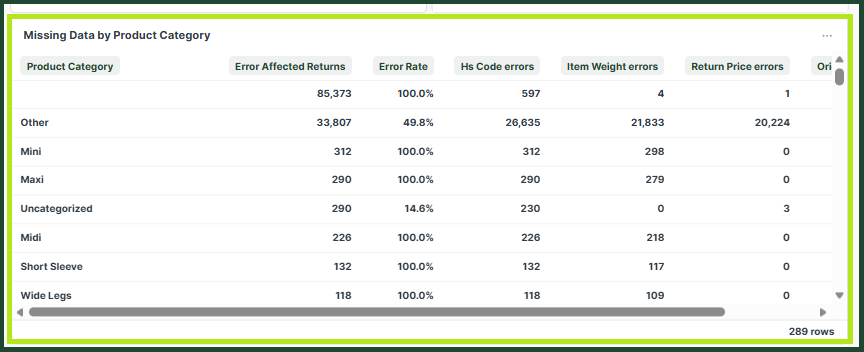
This table provides a breakdown of items with at least one missing customs-related data field, grouped by product category for the selected date range.
The table also includes the Error Rate, which represents the percentage of international items containing one or more missing data points relative to the total number of international orders.
In addition, the table displays the total number of items per product category affected by each specific data quality issue individually, including:
- HS Code errors
- Item Weight errors
- Return Price errors
- Origin Country errors